Katie and I were having a discussion recently about data, and one of the points she brought up in the discussion was that data is a very large umbrella term. We – especially me – tend to think of data in the context of marketing analytics as numbers, but there’s much more to it than that. The very words I’m typing right now are data.
Why does this matter? As with anything, definition is vision. We look for what we know to look for – ask and ye shall receive, seek and ye shall find, as the expressions go. If I think of data only as numbers, then numbers are all I’ll be looking for. If we expand our definitions, we expand our vision.
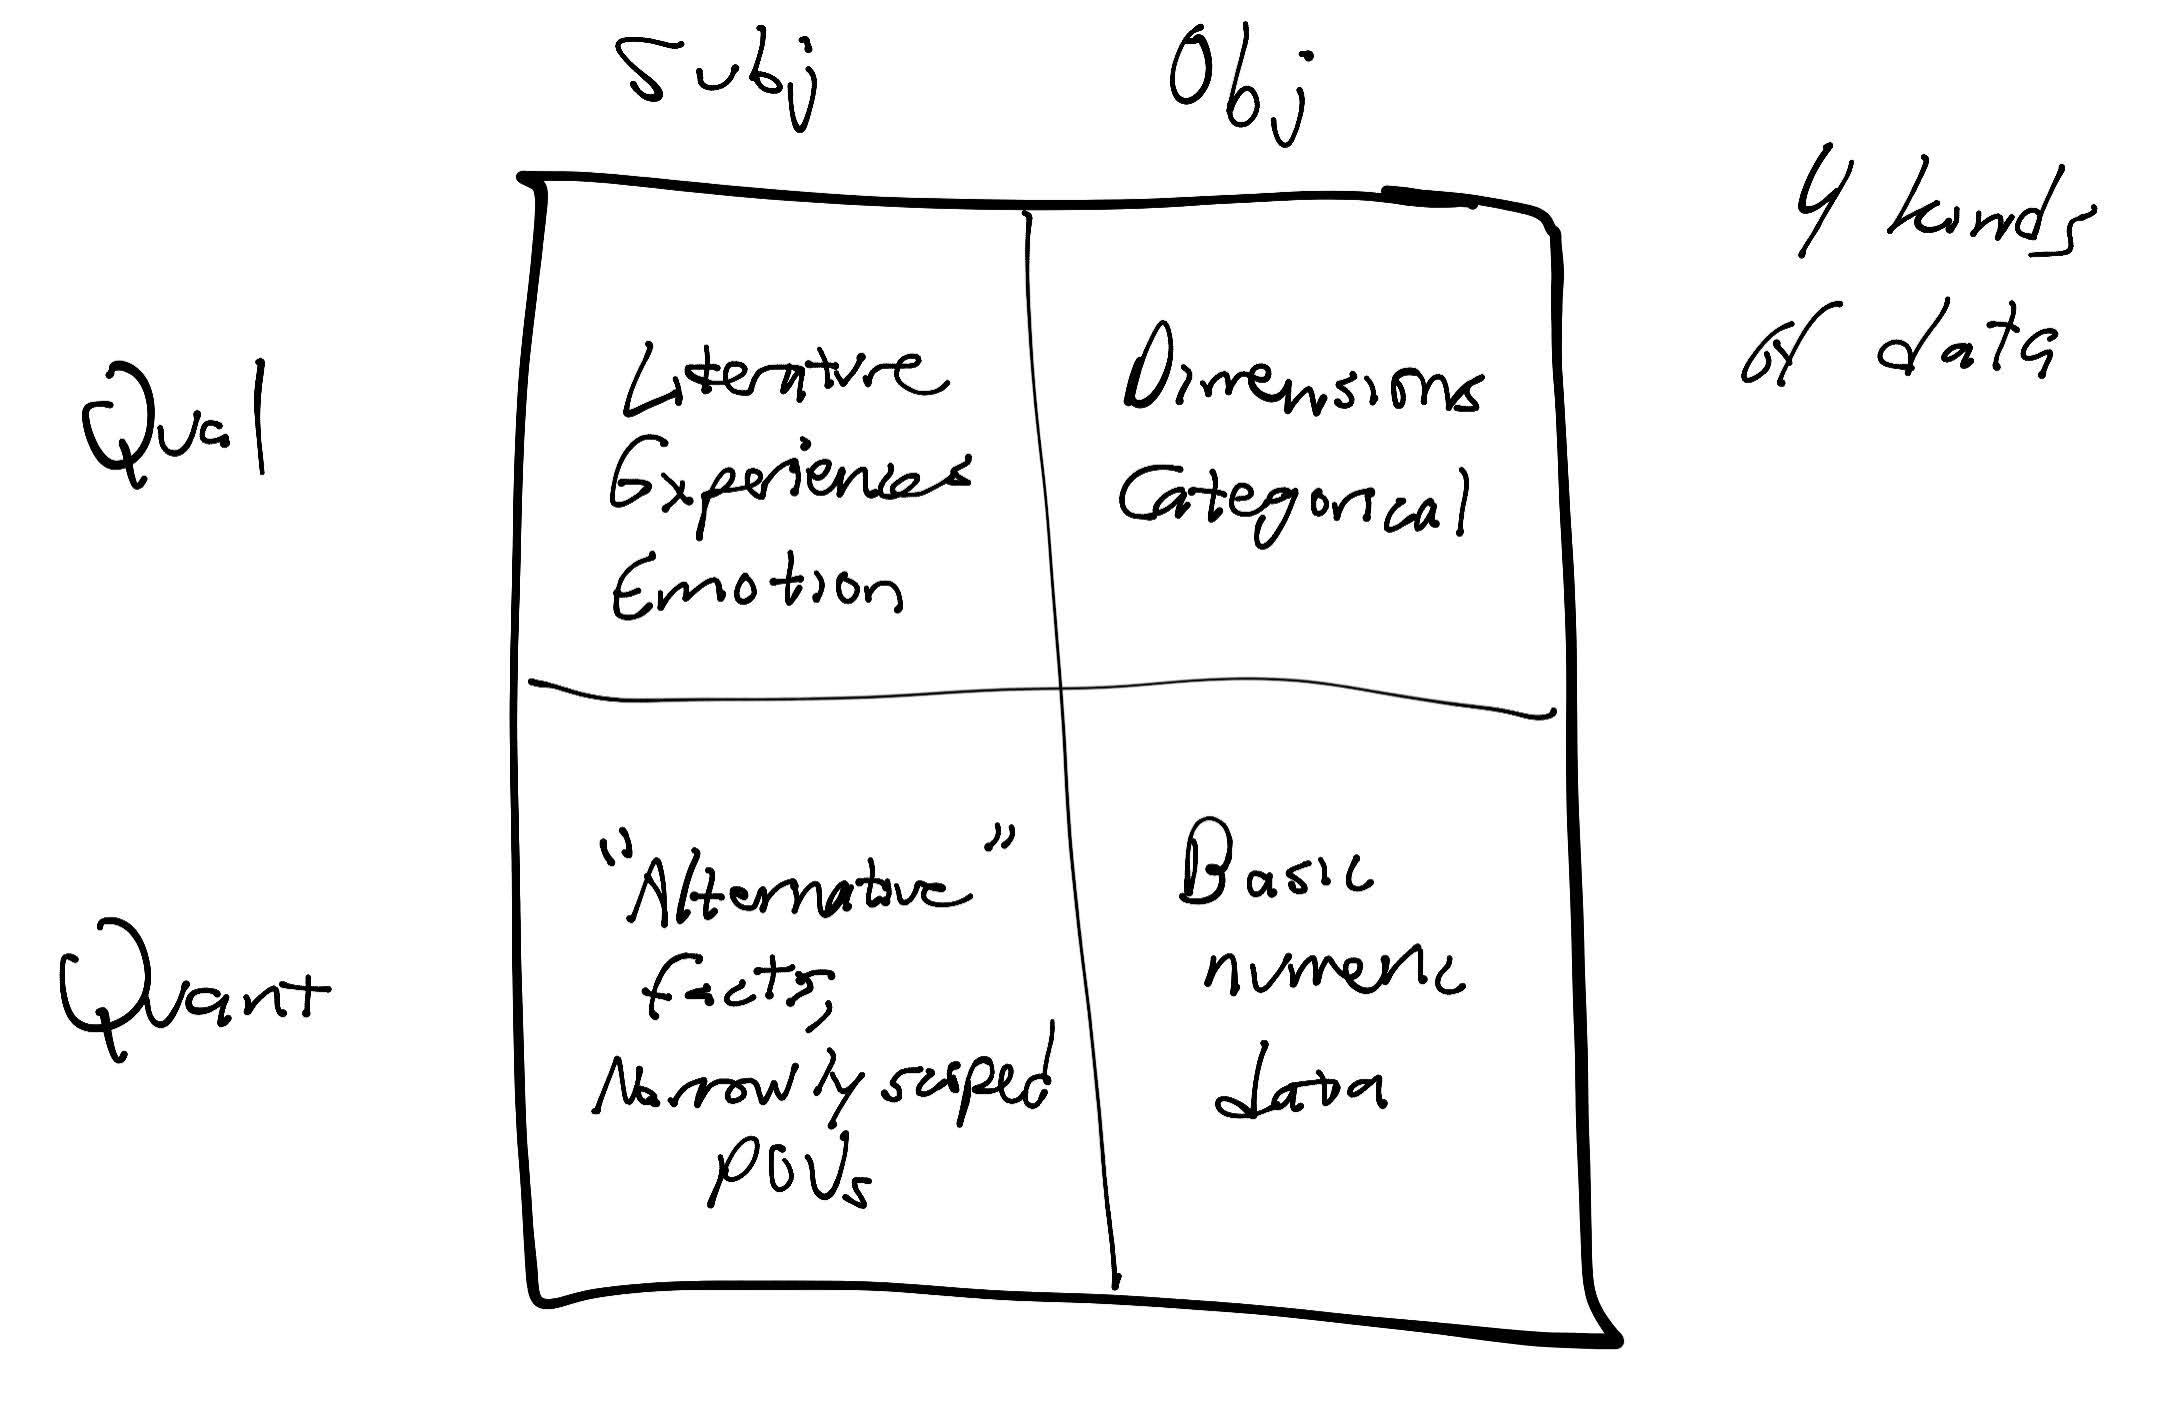
So, what does a bigger picture, a bigger definition of data look like? The trusty, venerable 2×2 matrix popped in my head while I was running, thinking about data in the context of analytics. We have subjective opinions, and we have objective facts. We have data that’s numbers, and data that’s not.

Objective quantitative data is pretty easy to understand. These are numbers like the number of people who visited our website yesterday. Straightforward, easy to work with, easy to process. Not a ton of depth, necessarily, because there’s no nuance. We’re use to working with this in analytics software.
Objective qualitatitve data is also fairly easy to understand. In the world of analytics, these are your categories, your dimensions. They’re not numbers, but they’re still objective facts. The piece of content you’re reading now is text. The graph above is an image. There’s no number to assign to it, but these are still data types.
Subjective qualitative data is a massive category. This is data that’s non-numeric, but subjective in how we interpret and understand it. It’s literature, experiences, rich media, emotions, tone of voice, sentiment, all the things that make us human. This is the data you get in interviews, surveys, focus groups – everything where we’re asking someone why they did what they did. One of the things that’s interesting about subjective qualitative data is that there are far fewer right or wrong answers. A piece of art will be beautiful to some people, ugly to others. A podcast may appeal to some audiences, while others will be wholly disinterested.
Subjective quantitative data is an interesting category. It’s data that is numeric but based on opinion. There are some broad strokes here, from "alternative facts" where people not only interpret data differently but have their own data (regardless of credibility). Subjective quantitative data also appears more benignly in things like surveys and ratings. A product that has 4,800 5-star ratings on Amazon is quantitative data, but the data itself isn’t objective. The product may well and truly suck, or it may be completely amazing. Subjective quantitative data can also appear in the context of opinion about data; listen to any earnings call and you’ll hear CFOs give opinions and guesses about the financial outlook for a company. These are not facts, but they are numbers.
Why does all this matter? If we’re in the business of data analytics (which my company is), and we’re in the business of making data useful, then we need systems and processes to work with the different kinds of data, especially when that data may be in unfamiliar formats. We also need an understanding of the different kinds of data and how they’re contained, so we know what to look for in the data. All data contains biases, but subjective data is likely to contain far more bias because it’s subjective by nature.
Types of data also impact tooling and capabilities. Consider Instagram for a moment. Instagram posts contain multiple data formats: text for the description, which can be subjective or objective ("photo of my dog" vs "best dog in the world"), numbers for the levels of engagement, and objective data in the format of a video or photo. There’s a ton to unpack there; how many Instagram analytics tools unpack it all?
Remember, definition is vision. What we understand defines the boundaries of what we’re looking for. Make sure you’re working with the scope of vision appropriate to the data you’re handling.
You might also enjoy:
- Almost Timely News: Principles-Based Prompt Engineering (2024-02-25)
- You Ask, I Answer: Retrieval Augmented Generation for Tax Law?
- Almost Timely News, January 14, 2024: The Future of Generative AI is Open
- Mind Readings: You Need Passwords for Life in the Age of Generative AI Fraud
- Mind Readings: Generative AI and Addition vs Substitution of Jobs
Want to read more like this from Christopher Penn? Get updates here:
 Take my Generative AI for Marketers course! |


Leave a Reply