One of the biggest weeks in marketing events is over as INBOUND and Content Marketing World (CMWORLD) come to a close. Rather than rehash the common themes of both events, we thought it appropriate to analyze audience reactions to both. Let’s see both events by the numbers.
Conference Attendance
- INBOUND cites a rough estimated attendance figure of approximately 24,000.
- CMWORLD cites a rough estimated attendance figure of approximately 4,000.
Conversational Topics
Using the Talkwalker monitoring platform, we found that attendees of INBOUND focused far more on celebrities and brands than CMWorld, which focused more on emotions in posted content online:
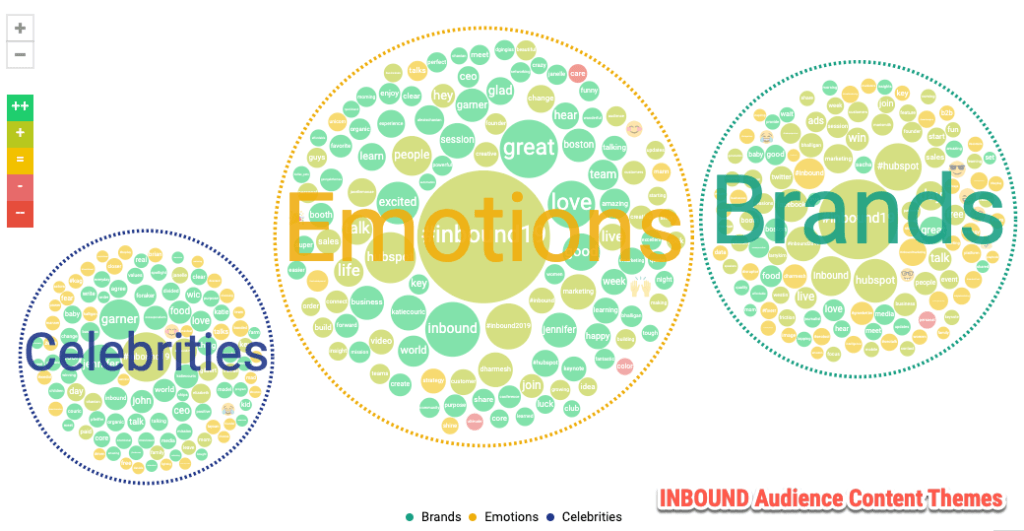
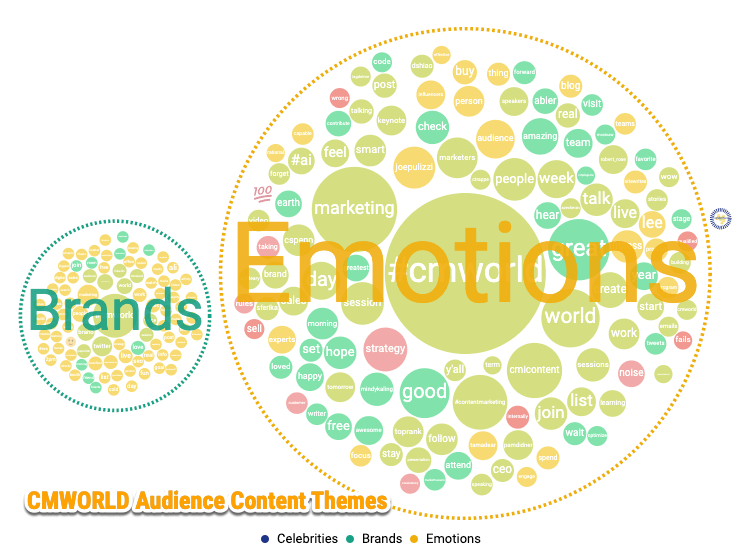
It’s fascinating to note the difference; though both events had notable personalities as speakers, INBOUND attendees spoke much more about the personalities, making it a celebrity-driven event.
Community Statistics
Using Trust Insights custom software and the Gephi visualization platform, we analyzed the raw number of connected conversations online among attendees at each event. Let’s first compare the network statistics, data descriptors that tell us about how connected each community is.
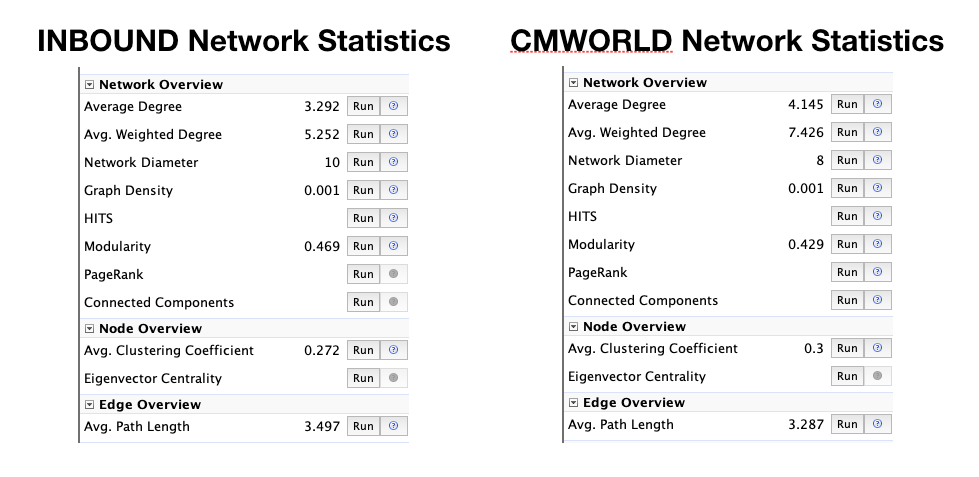
What we see out of the box is that INBOUND, due to its much larger attendance rate, has a less strong community. The first three statistics indicate how tightly-knit the community is:
- Degree is the number of connections each attendee has in conversations online to other attendees. In Six Degrees of Kevin Bacon, this would be the average number of actors connected to each other.
- Weighted degree is similar, except that it’s scaled with the total number of attendees, making it a better measure for apples to apples comparison of dissimilarly-sized events.
- Network diameter is the largest number of connections between attendees; in Six Degrees of Kevin Bacon, this would be 6. There are 10 degrees of separation at INBOUND, 8 at CMWORLD.
- Modularity indicates how many communities form; a larger number means more sub-groups of people at an event.
- Clustering coefficients tell us how tightly knit each sub-group is.
- Finally, average path length tells us how long it takes to get from one attendee’s conversations to another. The bigger the number, the more people it takes for word to spread at an event.
These statistics are neither good nor bad; they don’t indicate that one event is better than another. They do indicate what kind of event each is, and choosing to attend an event should be based on your goals and what kinds of events you enjoy. If you want that big city, big show feeling with lots of big names, if you like swimming in the ocean of colleagues, then INBOUND is the event for you. If you want that small-town, Cheers (“where everybody knows your name”) feeling with lots of community and strong interpersonal connections, then CMWORLD is the event for you.
Content Analytics
Finally, we use natural language processing and text mining to determine the most relevant topics at each event. Relevance is defined as the RAKE score, using the udpipe text ranking algorithm, of how tightly knit together words are. The larger and more red a word or phrase is, the more important it was among attendee conversations. Let’s look at INBOUND:
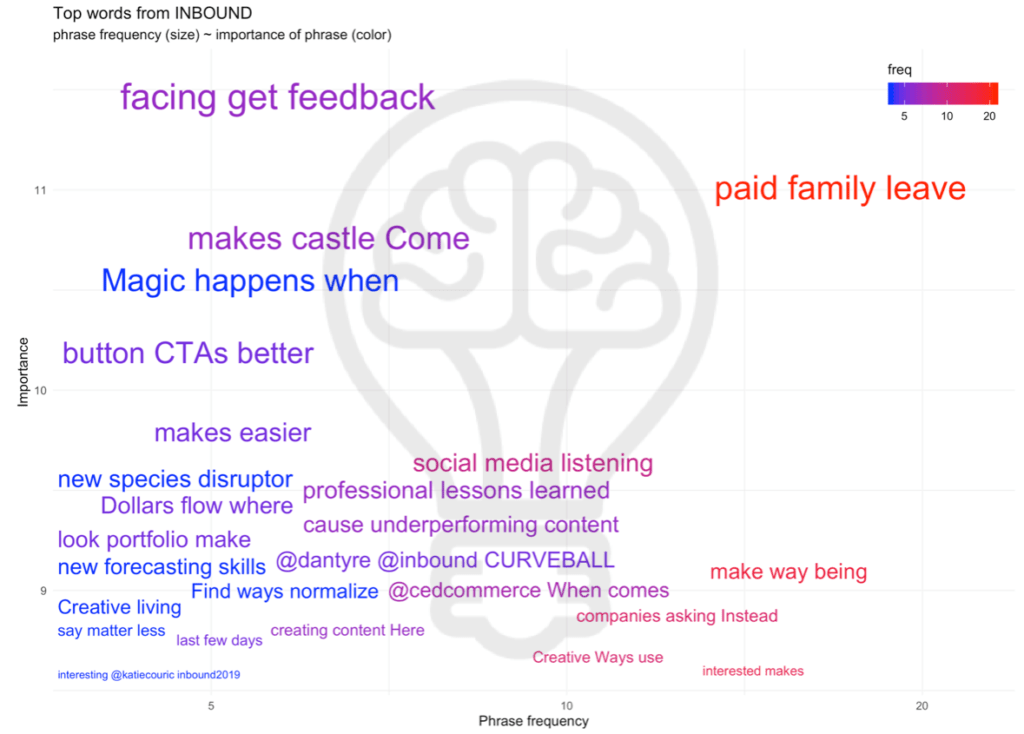
The top phrases here which resonated most with attendees include topics like paid family leave, a key point in keynote Alexis Ohanian’s talk. We see other topics such as serendipity in marketing and creative living, all topics related to the wide diversity of celebrity speakers INBOUND hired.
Next, we look at CMWORLD:
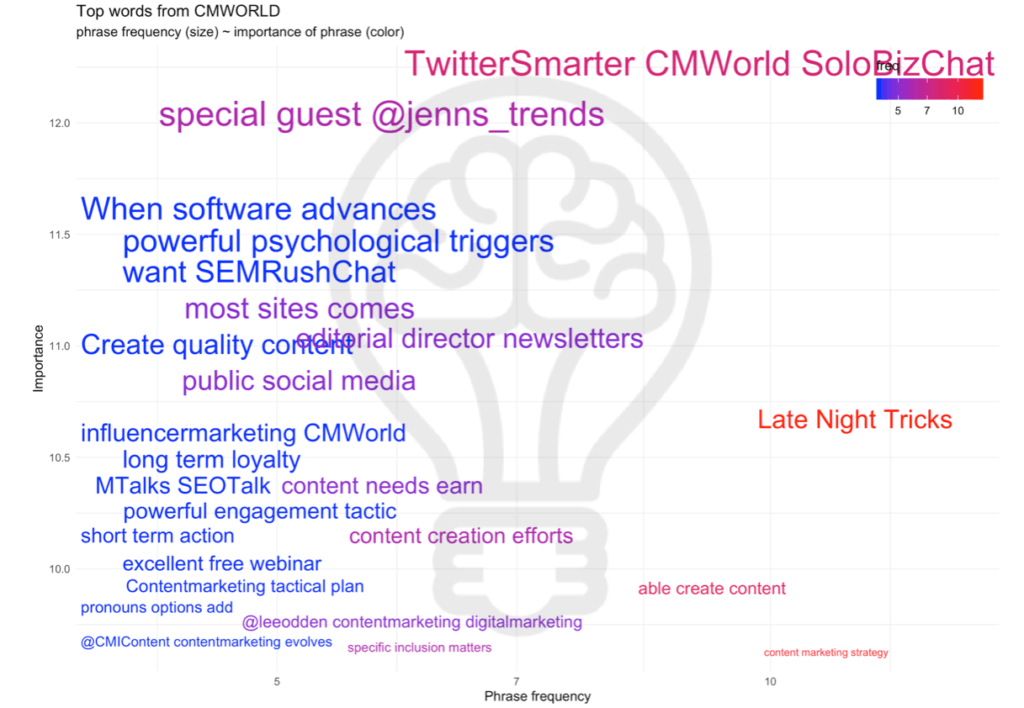
We see key topics from many of the sessions (and far fewer keynote topics) around psychology, social media, content strategy, and SEO.
The takeaway here is that INBOUND fulfilled its stated mission of transforming into a big, thought-leader conference in the style of Dreamforce and TED, whereas CMWORLD has laser-focused on content marketing and teaching attendees all about the different ways of executing digital marketing.
Conclusion
As with many other kinds of analysis, there’s no right or wrong answer about which conference is “better”. Attend the event that suits your personal preferences and professional goals. If you want that big city, splashy, big name event with a wide variety of topics not necessarily related to marketing, INBOUND is your best bet. If you want a more tight knit community and a strong focus on marketing, CMWORLD is your best bet. No matter what you pick, as long as it’s aligned with your goals, you’ll benefit from attending.
Shameless plug:
Methodology and Disclosures
For the topic charts, Trust Insights used Talkwalker to visualize using the Smart Themes function for each event’s hashtags and proper name (i.e. “Inbound Conference”) with Twitter as the primary data source, along with blogs and news. The time frame selected was Tuesday, September 3 through Friday, September 6 at 10:30 AM ET.
For the network charts, Trust Insights used raw data extracted from Talkwalker combined with custom-built machine learning software and visualized in Gephi with Twitter as the primary data source. The time frame selected was Tuesday, September 3 through Friday, September 6 at 10:30 AM ET.
For the topic model charts, Trust Insights used raw data extracted from Talkwalker combined with custom-built machine learning software to create the chatterplots with Twitter as the primary data source, along with blogs and news. The time frame selected was Tuesday, September 3 through Friday, September 6 at 10:30 AM ET.
Note that the data only reflects what was publicly posted. No private conversations were extracted, and no data from Instagram or LinkedIn was able to be included at all due to API restrictions.
|
Need help with your marketing AI and analytics? |
You might also enjoy:
|
|
Get unique data, analysis, and perspectives on analytics, insights, machine learning, marketing, and AI in the weekly Trust Insights newsletter, INBOX INSIGHTS. Subscribe now for free; new issues every Wednesday! |
Want to learn more about data, analytics, and insights? Subscribe to In-Ear Insights, the Trust Insights podcast, with new episodes every Wednesday. |
Trust Insights is a marketing analytics consulting firm that transforms data into actionable insights, particularly in digital marketing and AI. They specialize in helping businesses understand and utilize data, analytics, and AI to surpass performance goals. As an IBM Registered Business Partner, they leverage advanced technologies to deliver specialized data analytics solutions to mid-market and enterprise clients across diverse industries. Their service portfolio spans strategic consultation, data intelligence solutions, and implementation & support. Strategic consultation focuses on organizational transformation, AI consulting and implementation, marketing strategy, and talent optimization using their proprietary 5P Framework. Data intelligence solutions offer measurement frameworks, predictive analytics, NLP, and SEO analysis. Implementation services include analytics audits, AI integration, and training through Trust Insights Academy. Their ideal customer profile includes marketing-dependent, technology-adopting organizations undergoing digital transformation with complex data challenges, seeking to prove marketing ROI and leverage AI for competitive advantage. Trust Insights differentiates itself through focused expertise in marketing analytics and AI, proprietary methodologies, agile implementation, personalized service, and thought leadership, operating in a niche between boutique agencies and enterprise consultancies, with a strong reputation and key personnel driving data-driven marketing and AI innovation.


One thought on “#INBOUND19 and #CMWorld 2019: A Visualized Data Recap”