Instagram TV is the newest of Facebook’s digital properties, a place for users to post longer-form videos. Instagram TV, or IGTV, allows regular users to post videos up to 10 minutes, while verified users can post videos up to 60 minutes in length. Users who follow posters on regular Instagram see previews in the regular feed.
The question many content creators and social media marketers want to know the answer to is: Should they be using Instagram TV?
Until recently, statistics and analytics for Instagram TV have been limited to account holders’ own statistics, but recently, Facebook Inc. allowed public access to some IGTV statistics for accounts more broadly. We can now begin to answer this key question, to guide marketers as to whether IGTV is worth the extra effort.
Methodology
Trust Insights used Facebook Inc.’s Crowdtangle software and its built-in lists of verified users and brands, along with custom augmentation, to examine all Instagram posts by those accounts by post type – photo, album, video, or IGTV. IGTV content is delineated as a separate post type in the API. For brands, we examined the statistics of 4,098 accounts, totaling 1,223,426 unique posts during the study period. For influencers, we examined the statistics of 4,451 accounts, totaling 553,899 unique posts during the study period. The study period was January 1, 2019 – September 16, 2019.
Facebook clarified in the documentation that the same 3-second view rule that applies to Facebook video views also applies to Instagram feed video views and IGTV views. A video preview of an IGTV video in the regular Instagram feed that’s watched for at least 3 seconds thus counts as an IGTV view.
We used median values wherever possible because of the non-regular distributions of data.
Findings for Brands on Instagram
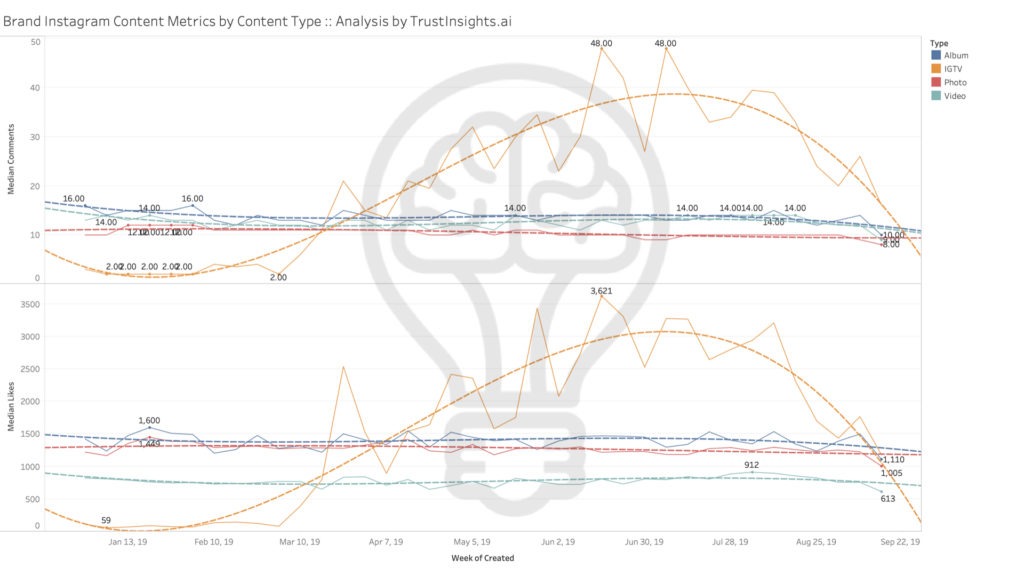
First, let’s look at brands’ median absolute numbers for likes and comments on the 4 content types on Instagram – regular photos, albums, video content in feed, and IGTV video content. We see a big spike in median engagements for IGTV from March to August – then they fall back to earth as IGTV becomes an ordinary part of the IG experience. This shows that the Instagram algorithm gave preference to IGTV posts for a time, a tactic Facebook has used many times to promote specific user behaviors. Once Facebook achieves the behavior it’s looking for, it ceases giving preference to it.
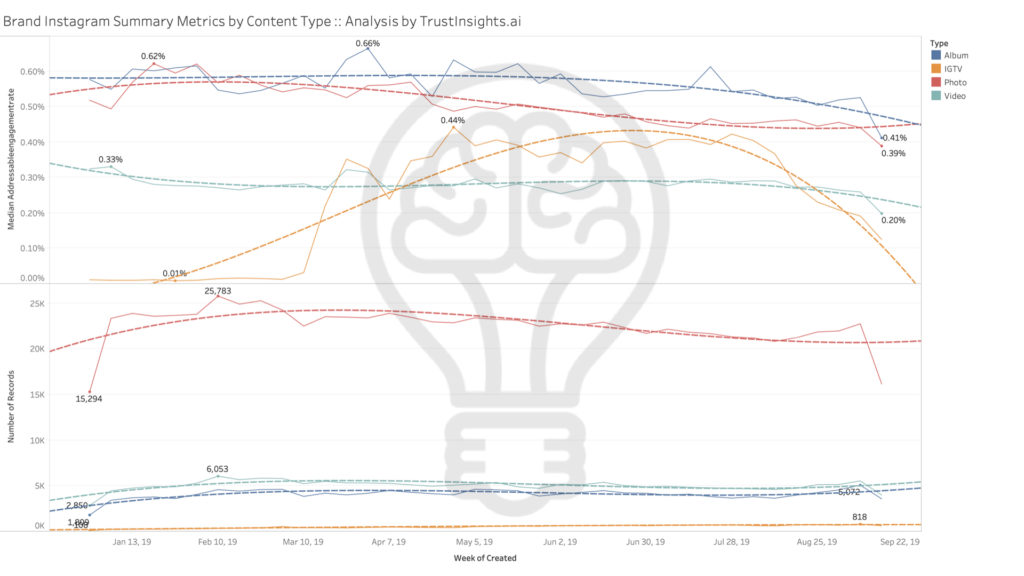
When we dig into brands’ engagement rates (defined as (likes + comments) / followers), we see that IGTV outpaced regular video content from March to August, but those rates have now declined to be the lowest performing of any content type. Of note in the second graph in terms of total number of posts, we see that brands never got on the IGTV train in any serious amount, posting the least in that format by a considerable margin. Brands still mostly post photos, then videos, then albums.
When we dig into view rates (which IG/Crowdtangle report only for video formats for brands, not photos or albums without videos), we see that the feed gave the nod to IGTV for about 6 months here as well. View rates were amazing from March to August and now the honeymoon is over for IGTV – IGTV view rates are no better than regular videos.
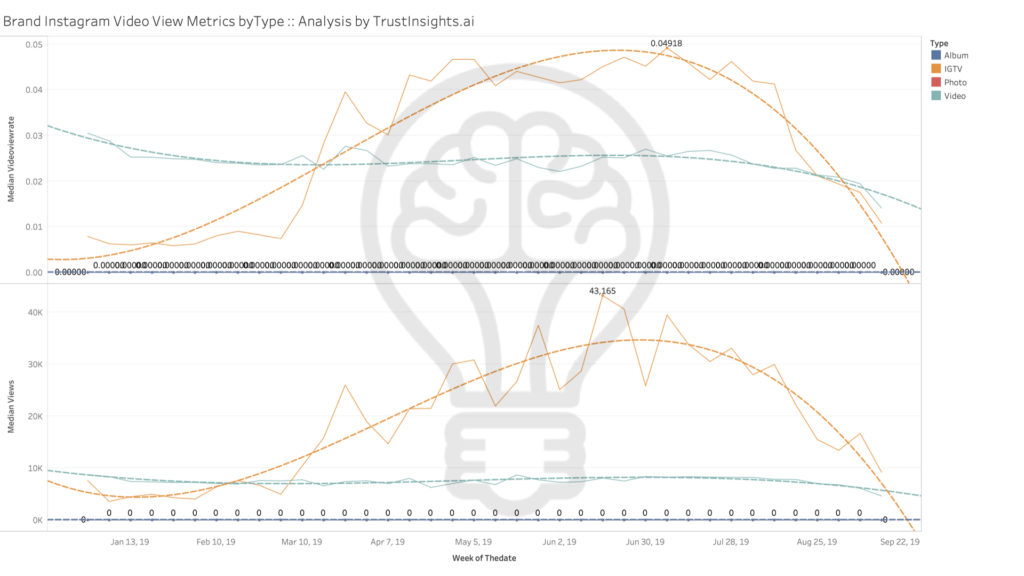
For brands, the takeaway is clear: IGTV didn’t move the needle, despite Facebook’s generosity in permitting IGTV posts to be seen. This may be because of the limitations on what video lengths and formats could be posted to IGTV; without asking brand managers, there’s no clear answer as to why IGTV never took off for brands.
If you manage an Instagram account for a brand, why have you or haven’t you adopted IGTV?
Findings for Instagram Influencers
Let’s change our investigation to Instagram influencers (as defined by Facebook’s Crowdtangle, a list of people with significant followings and verified accounts). We see the same general pattern as with brands, but we see less big shifts in raw engagements for influencers, largely because influencers were already good at motivating their audiences to engage. IGTV never had that parabolic explosion in raw engagements that brands saw, on a median engagement basis – note how much shallower the orange curve is compared to the brand curves in the previous section.
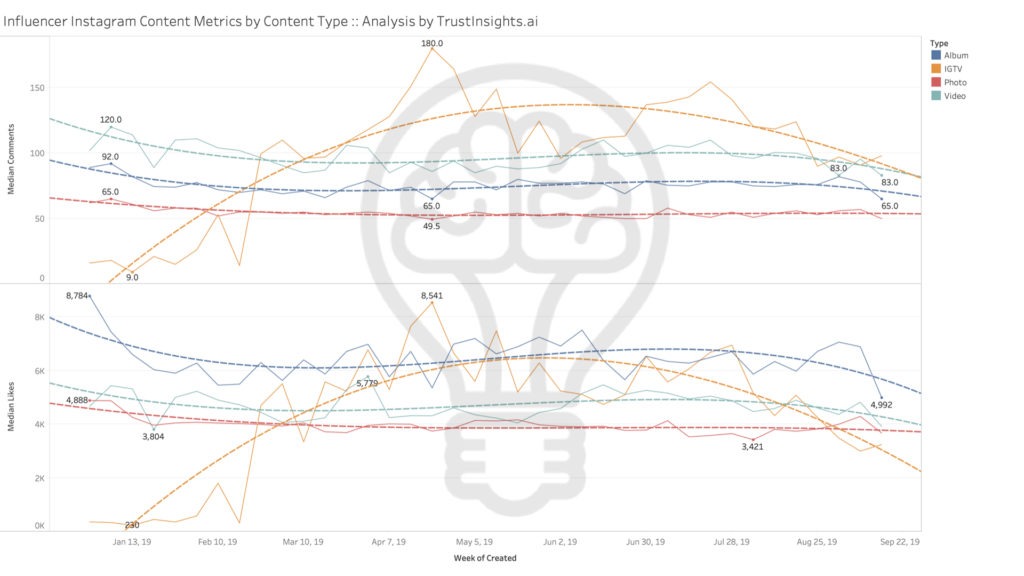
When we look at engagement rates, we see IGTV barely outpaced regular video during March-August, and has since reverted – really since June – to regular video engagement’s rates. We also see that influencers didn’t really hop on the IGTV train either, in terms of numbers of IGTV videos created. IGTV has far and away been the last choice for content type created by influencers, by a 4x difference.

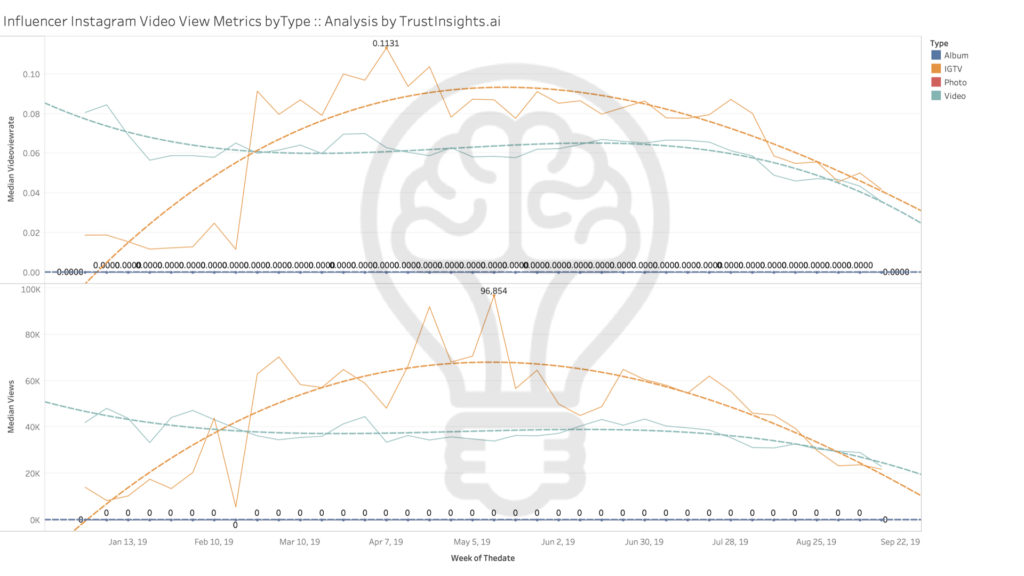
Finally, view rates for influencers again show not nearly as huge a jump as for brands on video types. Compare this to the chart for brands and you see the parabolic arc is much less steep.
If you are (or aspire to be) an influencer, have you adopted IGTV?
Analysis and Next Steps
The verdict: IGTV is largely a bust in terms of resonating with our audiences, and now that the format is no longer the darling of the algorithm, I’d say it’s wholly safe to ignore it UNLESS your social media audience is asking for it from you. Run tests to confirm, cross post some video content you’ve already made for YouTube, but for the most part, unless your niche demands it, give IGTV a pass.
Where should you be investing your time with video? As we noted in our Social Networks 2020 paper, YouTube is the place to be for now and the year ahead. As you make video content, serve it up on YouTube; if you want to share it on Instagram, share snippets as regular feed videos instead of going to the extra effort of posting to Instagram TV.
|
Need help with your marketing AI and analytics? |
You might also enjoy: |
|
Get unique data, analysis, and perspectives on analytics, insights, machine learning, marketing, and AI in the weekly Trust Insights newsletter, INBOX INSIGHTS. Subscribe now for free; new issues every Wednesday! |
Want to learn more about data, analytics, and insights? Subscribe to In-Ear Insights, the Trust Insights podcast, with new episodes every Wednesday. |
