

One key challenge to a successful data and analytics strategy is gaining consensus and alignment between the business and data science (data & analytic) stakeholders in identifying and prioritizing the use cases that 1) deliver sufficient value to the business, while 2) possess a high probability of success. One can find many use cases that can deliver compelling business value; however, many of these use cases have a low probability of execution success due to:
- Availability of timely, accurate data
- Inexperience with new data sources like social media, mobile, and sensor logs
- Limited data or analytic people resources
- Lack of experience with new technologies
- Weak business and data science collaborative relationship
- Lack of management fortitude
My favorite design tool for driving organizational alignment in the use case identification and prioritization process is the Prioritization Matrix. The Prioritization Matrix (Figure 1) facilitates the discussion and collaboration between the Business and Data Science stakeholders in identifying the “right” use cases to pursue – those use cases with both meaningful business value (from business stakeholders’ perspectives) and reasonable feasibility of successful implementation (from data science team’s perspective). See Figure 1.
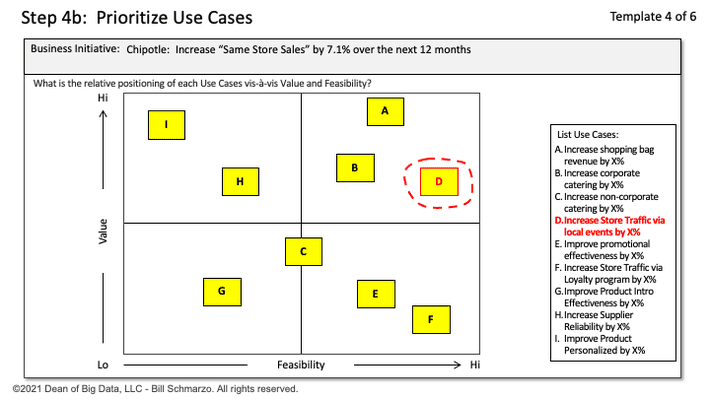
Figure 1: The Prioritization Matrix
Key aspects of the Prioritization Matrix in Figure 1:
- The Prioritization Matrix process provides a framework for driving organizational alignment around the relative value and implementation feasibility of each of the organization’s use cases.
- The Prioritization Matrix process weighs the “value” (financial, customer, operational, environmental) of each use case against the implementation feasibility (data, architecture, technology, skills, timeframe, management support) of those same use cases over the next 12 to 18 months.
- The Prioritization Matrix process, with a properly trained facilitator, gives everyone an active voice in the identification, discussion, and debate on use case value and implementation feasibility.
- The discussions, explanations, and justifications between the different stakeholders about the relative placement of each of the use cases may be the single most important outcome from the prioritization process.
Chapter 6 of my eBook “The Art of Thinking Like a Data Scientist” goes into great depth to explain the use of the Prioritization Matrix.
Weighted Prioritization Matrix
I recently watched Ari Katanick present to my Menlo College class how his organization has modified the Prioritization Matrix to help quantify the use case prioritization process. I was impressed with what he had done to quantify the Prioritization Matrix.
Ari and I discussed the organizational challenges of deciding between a “medium Value and high Feasibility” use case versus a “high Value and lower Feasibility” use case. I almost always recommend an organization start with a use case with “medium Value and high Feasibility” versus a use case with “high Value and lower Feasibility” and modified the weightings in Figure 2 accordingly.
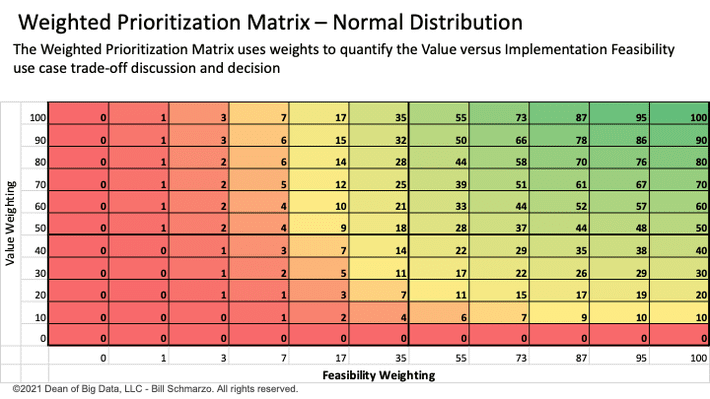
Figure 2: Weighted Prioritization Matrix
I used linear weights in Figure 2 on Value because 2x Value (weight of 40 versus weight of 80) is worth twice as much. My rationale: Free money is free money. Whether the use case delivers a 15% ROI versus a 30% ROI isn’t nearly as important as the fact that the use case delivered some positive ROI. Again, free money is free money.
However, I wanted to explore different weighting options that more realistically reflected that the cost of implementation failure is so much higher. Failure causes the business stakeholders to doubt the Data & Analytics organization and hampers long-term data and analytics adoption. It will be hard to get the business stakeholders to believe you the second time, or as my friends at Procter & Gamble use to say, “You never get a second chance to make a first impression.”
I explored three “Feasibility” weighting options: 1) harsh Fibonacci-like sequence, 2) softer Fibonacci-like sequence, and 3) a Normal Distribution-like sequence (see Figure 3).
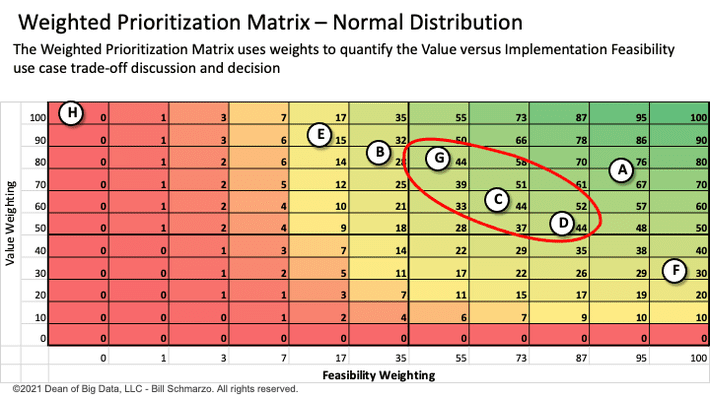
Figure 3: Assessment of Different Feasibility Weighting Options
I settled on the Normal Distribution-like weights to reflect that there is a normal inflection point where the feasibility of a project just becomes easier, and the Fibonacci-like sequences punished the middle feasibility projects too much. Yea, I probably way over-thought this process, but heck, that’s just me.
Finally, Figure 4 represents an example of the Weighted Prioritization Matrix in action.
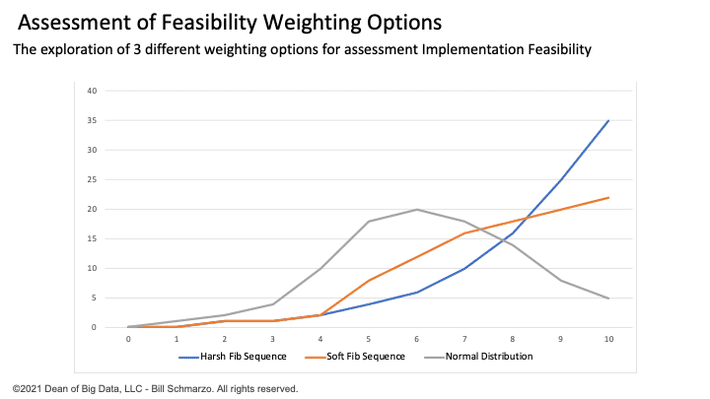
Figure 4: Weighted Prioritization Matrix Example
Some observations from the weightings of Use Cases in Figure 4:
- Use Case A is the clear winner from the perspective of both dimensions. Life should be so easy.
- The second Use Case is not quite as evident. From the weightings in Figure 4, there are 3 Use Cases (G, C, and D) that have the same overall score, but significantly different value and feasibility weightings. And deciding between those 3 is where the fun begins as the stakeholders begin to debate, cajole, argue, and plead for their use cases. But that debating, cajoling, arguing, and pleading will be based on discussions around value and feasibility, not based on the participant’s title or rank or levels of personal persuasion.
Note: As you successfully complete use cases, your feasibility scores should improve because each implemented use case builds out your data and analytic assets, which you can reuse in subsequent projects (see the Schmarzo Economic Digital Asset Valuation Theorem in Figure 3) not to mention building organizational data science and data engineering muscle, and business stakeholder confidence in the abilities of the Data & Analytics organization.
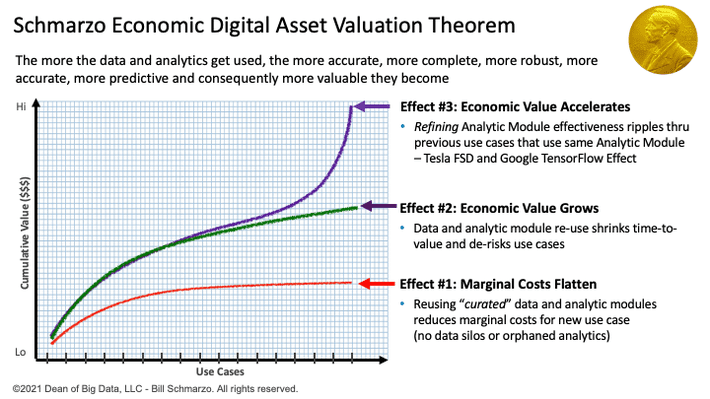
Figure 5: Schmarzo Economic Digital Asset Valuation Theorem
Developing Organizational Trust in Data and Analytics
While we understand from a data science perspective that “failure” is part of the analytics development process, it’s important that one “cheat” on the first project in selecting a use case where the feasibility score is higher so that the Data & Analytics organization can start to build the confidence of the business. That’s why I recommend that the first use case selection skew towards high feasibility (to start building that credibility). And as you build your credibility, you’ve earned the right to push the organization towards those “higher pay off, riskier” projects.
Note: if you want a copy of the spreadsheet, just DM me on LinkedIn and it is yours. Plus, I am open to and eager for any other weightings suggestions folks might have. Either post your ideas on the blog or DM me with your recommendations. Tanks.