Instagram TV is now over two years old and no longer the newborn in the Instagram media family, having been displaced by Reels. That said, a lot has changed in the past year; IGTV is fully integrated into the Instagram core application, and substantial amounts of video content exist for the platform.
The question marketers and content creators continue to ask that we aim to answer in this yearly series is: should they be using Instagram TV as an effective channel for distribution and promotion?
Findings for Brands on Instagram TV
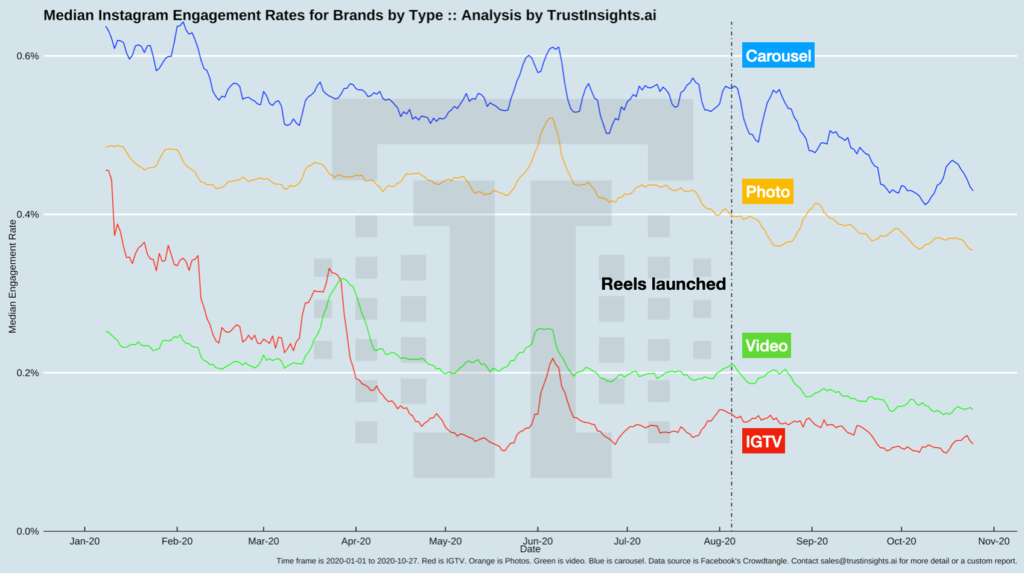
We first examine brands to see which channels create the most overall engagement by channel type: carousels (albums), photos, videos, and IGTV:

What we find is that all four media channels have shown substantial decline in 2020, even with a pandemic that forced people into digital media environments. We see the impacts of the pandemic in late March and again in June as the first two waves hit, especially in video and IGTV.
However, brands didn’t hold onto that attention. Looking across the channels, we see these declines in median engagement:
- IGTV: 75.6% decline
- Carousels: 32.5% decline
- Photos: 26.7% decline
- Videos: 39.3% decline
IGTV in particular started 2020 with an engagement rate of 0.45%; by late October 2020, that engagement rate had declined to 0.11%, a decline of 75.6% within the calendar year.
The message for brands is clear: IGTV delivers the worst engagement results of any of Instagram’s available media types.
Findings for Influencers on Instagram TV
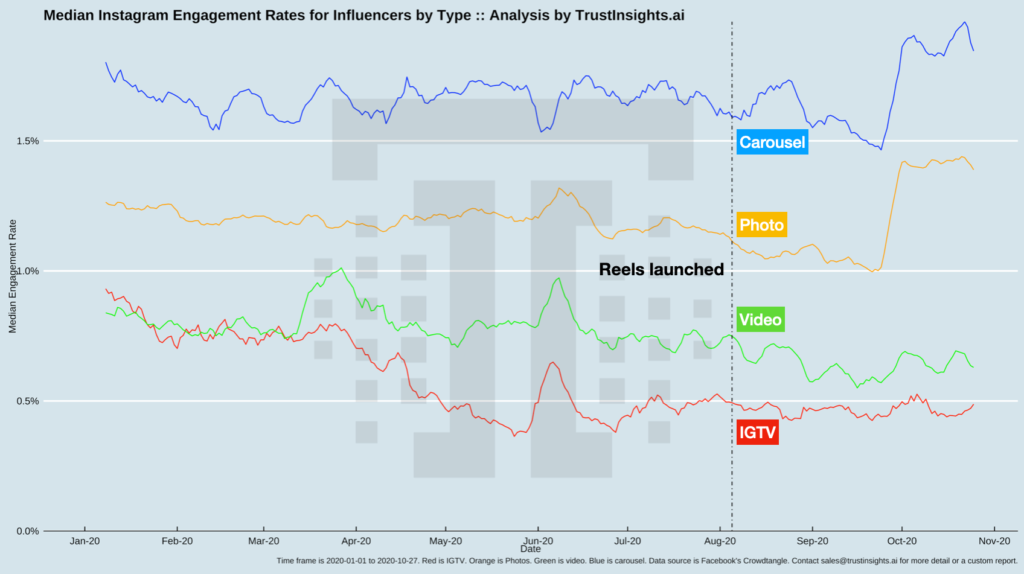
We next turn our attention to influencers. Recalling that Facebook uses audience size as its proxy for influence, how did these huge individual accounts perform?

We see a couple things worth noting. First, influencers have approximately 3x the engagement rates across channels that brands do. Second, we notice immediately that influencers have not seen the uniform declines in performance that brands experienced; some channels, such as carousels and photos, now show peak performance for the calendar year.
Influencers in general fared better in the calendar year by channel for median engagement:
- IGTV: 47.5% decline
- Carousels: 2.33% increase
- Photos: 9.89% increase
- Videos: 25.0% decrease
IGTV for influencers began 2020 at 0.93% engagement, and by the end of October 2020 had fallen to 0.49%, a decline of 47.6% – sharp, but not nearly as bad as for brands.
More important, for individual influencer accounts, the positive increases for carousels and photos shows that growth on Instagram in engagement is possible.
Instagram TV Analysis and Next Steps
The long term trend for Instagram TV is clear: it’s a bust, in terms of engagement, compared to other media types on the service. For both brands and marketers, if we want people to engage in the main feed, we need to be using carousels/albums as our primary media type.
An early concern with Reels is that the debut of Reels would cannibalize engagement from other video engagement types. For both brands and influencers, we see no time-based evidence that Reels have dampened engagement above and beyond the existing declines seen. Once Reels data becomes available in the Instagram measurement API, we’ll have a better sense of what the impact is.
Should you be using Instagram TV in 2020 for driving engagement? If you’ve already got video content suited for it and it requires no extra work on your part to publish, there’s no harm in doing so. However, if you have a budget or resource constraint and your choices are Instagram TV versus other Instagram formats, skip IGTV and do something else.
Methodology
Trust Insights used Facebook’s Crowdtangle software to extract 1,391,770 posts from 10,166 influencers and 1,225,486 posts from 3,992 brands. The study period was January 1, 2020 – October 27, 2020. Brand and influencer lists were provided by Facebook and augmented by Trust Insights. Facebook uses audience size as its primary measure of influence. Posts include paid and unpaid posts.
Stories are not included as Facebook has declared Stories data will not be included in the Instagram measurement API.
Reels are not included as Facebook has indicated Reels data will not be available until 2021 in the Instagram measurement API.
Facebook clarified in the documentation that the same 3-second view rule that applies to Facebook video views also applies to Instagram feed video views and IGTV views. A video preview of an IGTV video in the regular Instagram feed that’s watched for at least 3 seconds thus counts as an IGTV view.
Trust Insights is the sole sponsor of the study and neither gave nor received compensation for data used, beyond applicable service fees to software vendors, and declares no competing interests.
|
Need help with your marketing AI and analytics? |
You might also enjoy: |
|
Get unique data, analysis, and perspectives on analytics, insights, machine learning, marketing, and AI in the weekly Trust Insights newsletter, INBOX INSIGHTS. Subscribe now for free; new issues every Wednesday! |
Want to learn more about data, analytics, and insights? Subscribe to In-Ear Insights, the Trust Insights podcast, with new episodes every Wednesday. |


